

How Powerplay Performance Affects T20 Match Analysis
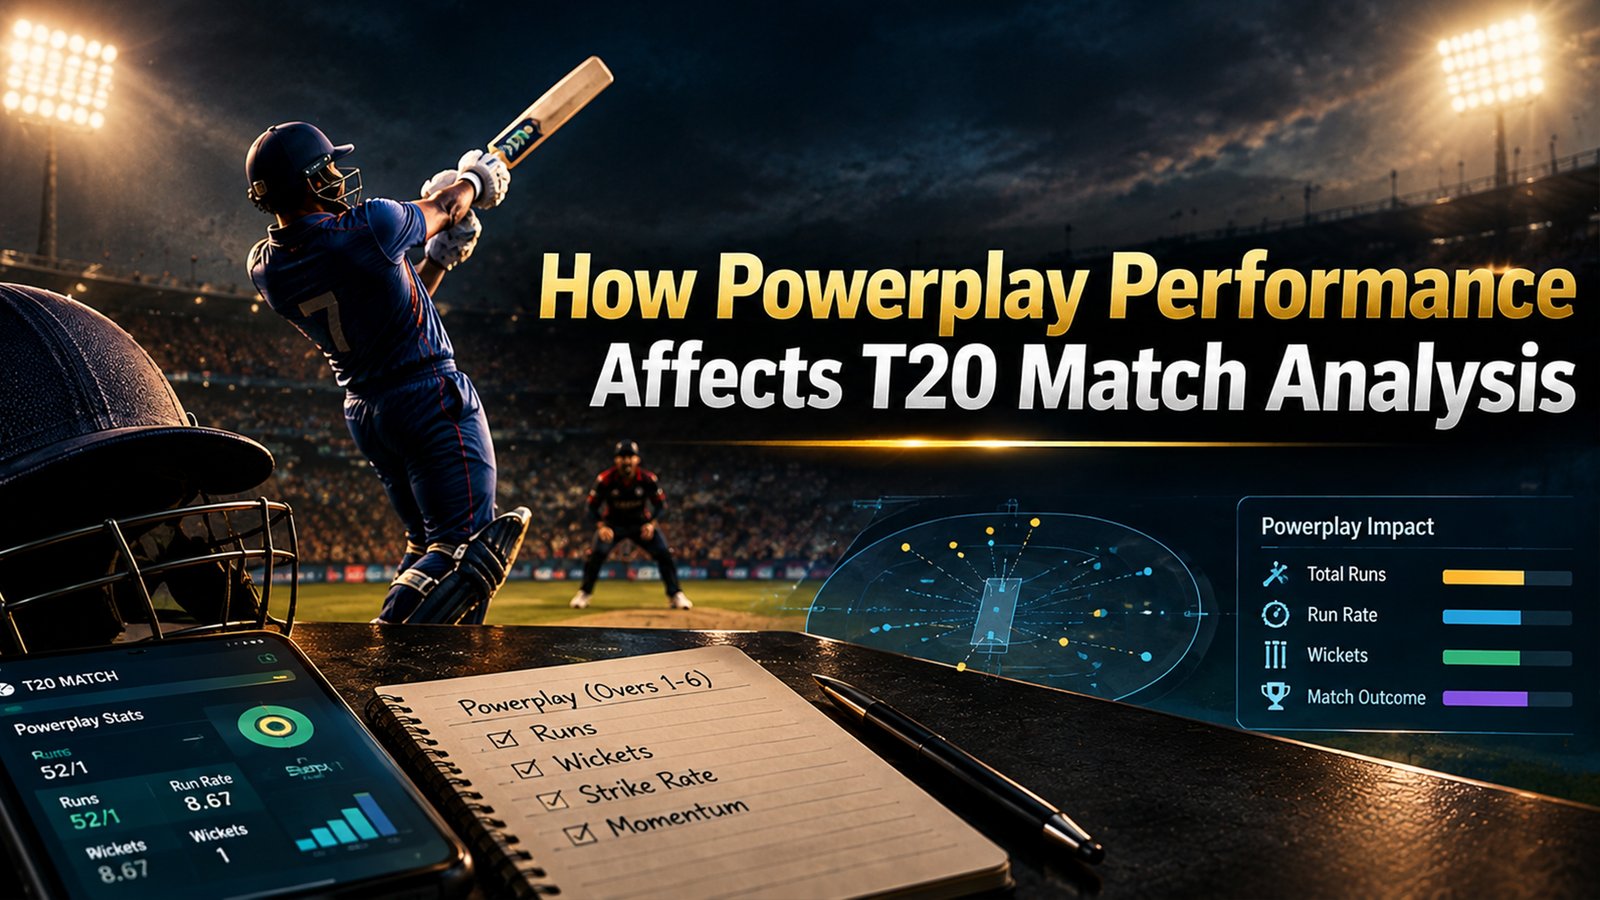
The first six overs of a standard T20 innings can provide valuable information for analyzing how a match is developing. During this period, fielding restrictions limit the number of players who can be positioned outside the fielding circle, creating different tactical opportunities for batters and bowlers.
For analysts and cricket fans, powerplay performance can reveal important information about scoring intent, wicket risk, bowling quality and the conditions at a particular venue.
However, powerplay statistics should not be viewed in isolation. Opposition strength, pitch conditions, player roles, match situation and sample size can all affect the numbers.
What Is the T20 Powerplay?
In a standard T20 International, the powerplay consists of the first six overs of each innings. During these overs, a maximum of two fielders can be positioned outside the fielding restriction area at the instant of delivery. After the powerplay, the fielding restrictions become less restrictive.
The restrictions create a different tactical environment from the middle and final overs.
Batters have more opportunities to find gaps because fewer fielders can be positioned on the boundary. At the same time, bowlers can attack with the new ball and attempt to take early wickets.
This creates an important trade-off:
More attacking batting can increase the scoring rate, but it can also increase wicket risk.
Why Powerplay Performance Matters in T20 Cricket
T20 cricket provides only 20 overs, meaning every phase of the innings has significance.
A strong powerplay can provide a team with an early scoring platform, while early wickets can force the middle order to change its approach.
For example, consider two teams that both score 55 runs during their first six overs:
- Team A: 55/0
- Team B: 55/3
The headline score is identical, but the match situation is very different.
Team A retains all of its wickets and can potentially attack later in the innings. Team B has already lost three wickets and may need to rebuild.
This is why powerplay runs should always be analyzed together with powerplay wickets.
Research examining T20 data has also identified relationships between early-innings performance and final innings outcomes, although the exact relationship depends on the dataset and analytical method used.
Key Powerplay Batting Metrics
Powerplay Run Rate
Run rate measures how quickly a team scores.
The basic calculation is:
Run Rate = Runs Scored ÷ Overs Bowled
For example, if a team scores 54 runs in six overs:
54 ÷ 6 = 9.00 runs per over
Run rate provides a quick way to compare scoring speed.
However, it should be adjusted for context. A 9.00 powerplay run rate against a strong bowling attack may be more impressive than the same rate against weaker opposition.
Wickets Lost
Wickets are one of the most important pieces of powerplay information.
A team that scores quickly while retaining wickets may have more flexibility in the middle and final overs.
Conversely, losing multiple wickets early can reduce the number of established batters available later.
Therefore, a useful powerplay analysis should record both:
Runs + Wickets
rather than considering runs alone.
Strike Rate
Strike rate measures how quickly an individual batter scores.
The formula is:
Strike Rate = Runs ÷ Balls Faced × 100
Powerplay strike rate can be particularly useful when comparing opening batters.
However, strike rate should be considered alongside dismissals, boundary percentage, opposition quality and batting role.
Boundary Percentage
Boundaries can show how a team or player is generating runs.
A high boundary percentage may indicate aggressive shot selection, while a lower percentage may indicate greater reliance on running between the wickets.
Neither approach is automatically better. The match situation determines how valuable each approach may be.
Dot-Ball Percentage
Dot balls are another useful powerplay indicator.
A high percentage of dot balls can restrict scoring pressure, while frequent singles and boundaries can keep the batting side moving.
For bowlers, creating dot balls can be an important part of controlling the powerplay.
Key Powerplay Bowling Metrics
Powerplay Economy Rate
Economy rate measures how many runs a bowler concedes per over.
A simple calculation is:
Economy Rate = Runs Conceded ÷ Overs Bowled
For example, if a bowler concedes 18 runs in three overs:
18 ÷ 3 = 6.00
Economy rate becomes more useful when combined with wickets and dot balls.
Powerplay Wickets
Early wickets can have significant tactical importance.
A bowling unit that regularly removes opening batters may prevent the batting side from fully exploiting the fielding restrictions.
However, analysts should consider the circumstances behind those wickets. A bowler taking wickets at a very high economy rate may be producing a different type of contribution from one taking wickets while also restricting runs.
New-Ball Performance
The first overs can present opportunities for fast bowlers because the new ball may offer movement.
Swing, seam, bounce and pace can affect how comfortable opening batters are.
Therefore, powerplay analysis should consider whether a venue historically helps new-ball bowling.
Bowling Matchups
Not every batter performs equally against every bowling style.
A batter’s performance against pace, spin, left-arm bowling or right-arm bowling can provide additional context.
Similarly, a bowling team’s powerplay results can change depending on which bowlers are available.
How to Analyze a Team’s Powerplay Performance
A practical analysis can follow these steps.
Step 1: Check Recent Powerplay Runs
Look at the team’s powerplay scores over a meaningful sample of recent matches.
Avoid basing conclusions on one or two games.
Step 2: Check Powerplay Wickets
Record how many wickets the team typically loses during the first six overs.
A high scoring rate accompanied by frequent wickets should be interpreted differently from a high scoring rate with strong wicket preservation.
Step 3: Examine Run Rate
Compare the team’s powerplay run rate with:
- Tournament average
- Opponent average
- Venue average
- Recent team performance
Step 4: Analyze the Opening Batters
Check:
- Runs
- Balls faced
- Strike rate
- Boundary rate
- Dismissals
- Performance against the expected bowling attack
Step 5: Analyze the Opening Bowlers
Look at:
- Economy rate
- Wickets
- Dot balls
- Boundaries conceded
- Performance with the new ball
Step 6: Consider the Venue
A team’s historical powerplay numbers may not translate directly from one ground to another.
Pitch behavior, boundary dimensions and weather can influence the first six overs.
Step 7: Consider the Opposition
Statistics should be evaluated against the quality of the opponents faced.
A team that has recently faced several elite bowling attacks may have lower powerplay numbers than a team that has faced weaker attacks.
Powerplay Performance and T20 Match Outcomes
Powerplay performance can contribute to the shape of a T20 match, but it should not be treated as a standalone prediction.
An early advantage can disappear quickly through:
- A middle-order collapse
- A strong bowling spell
- A high-scoring final five overs
- Excellent fielding
- Changing pitch conditions
- Successful run chasing
Historical research has found associations between powerplay performance and T20 match outcomes, but these relationships should not be interpreted as guarantees for individual matches.
The better analytical approach is to treat powerplay statistics as one component of a broader match model.
How Pitch, Venue and Opposition Affect Powerplay Numbers
Pitch Conditions
A pitch offering movement can benefit bowlers early in the innings.
A flat batting surface can create a different environment where aggressive batting is easier.
Boundary Dimensions
Short boundaries can increase the value of power hitters.
Large boundaries may make it more difficult to score through aerial shots and can increase the value of running between wickets.
Weather
Cloud cover, humidity, wind and other conditions can influence how the ball behaves.
These factors should be considered rather than assuming that a team’s historical powerplay average will remain constant.
Opposition Bowling Quality
The same opening pair may produce different results against different bowling attacks.
A powerplay average should therefore be viewed in context.
Practical T20 Powerplay Analysis Example
But the average alone does not tell the whole story.
The analyst should also ask:
- Who scored the runs?
- How many balls were faced?
- How many boundaries were hit?
- How many wickets were lost?
- Who bowled the first six overs?
- How strong were the opposition attacks?
- Were the matches played at similar venues?
- Was the team chasing or setting a target?
This additional context makes the analysis more meaningful.
Common Mistakes in Powerplay Analysis
Looking Only at Powerplay Runs
A 60-run powerplay sounds impressive, but 60/3 is different from 60/0.
Using a Very Small Sample
One exceptional performance can distort averages.
Use a sufficiently large sample before drawing conclusions.
Ignoring Opposition Quality
A statistic is more meaningful when you understand the level of competition behind it.
Ignoring Venue
Powerplay scoring can vary significantly between grounds.
Comparing Different Roles
An opening batter and a middle-order batter have different opportunities.
Their statistics should not automatically be compared directly.
Treating Historical Statistics as Guarantees
Past performance provides information, not certainty.
Ignoring Match Context
A team chasing a large total may deliberately take greater risks during the powerplay.
A team defending a modest score may choose a more conservative approach.
Powerplay Statistics and T20 Betting Analysis
Powerplay statistics can also form part of broader T20 betting-market analysis.
For example, an analyst might examine:
- Team powerplay run rate
- Powerplay wickets
- Opening-batter strike rates
- Opposition powerplay economy
- Venue scoring patterns
- New-ball wicket rates
- Recent team performance
However, statistical evidence should not be presented as a guarantee of betting profits.
A strong powerplay record does not automatically mean that a team will win its next match, and a high historical average does not necessarily mean that a particular market price represents value.
Anyone considering betting should also understand the legal requirements in their jurisdiction and the financial risks involved.
How to Use Powerplay Statistics Responsibly
A useful analysis should answer several questions before drawing conclusions:
- Is the sample large enough?
- Are the matches from the same T20 format?
- Has the team’s opening combination remained stable?
- Is the opposition comparable?
- Is the venue comparable?
- Are the same bowlers available?
- Have player roles changed?
- Is the match being played under similar conditions?
This helps prevent overconfidence based on a single statistic.
FAQs About T20 Powerplay Performance
What is a powerplay in T20 cricket?
A T20 powerplay is the first six overs of a standard T20 innings, during which fielding restrictions limit the number of fielders allowed outside the fielding restriction area.
How many overs are in a T20 powerplay?
In a standard 20-over T20, the powerplay consists of six overs. In shortened matches, the applicable powerplay can be reduced proportionally under the playing conditions.
Why is the powerplay important in T20 cricket?
Fielding restrictions create additional opportunities for batters to find boundaries, while bowlers can attempt to exploit the new ball and take early wickets.
What is a good T20 powerplay score?
There is no universal “good” score because scoring conditions vary by venue, opposition, pitch and match situation. A score should be compared with relevant historical averages rather than judged in isolation.
How is powerplay run rate calculated?
Powerplay run rate is calculated by dividing runs scored by the number of overs completed.
How do wickets affect powerplay performance?
Wickets can be as important as runs. A team scoring quickly while losing several wickets may face a very different middle-overs situation from a team achieving a similar score without losing wickets.
What is powerplay strike rate?
Powerplay strike rate measures how quickly an individual batter scores during the first six overs. It is calculated as runs divided by balls faced, multiplied by 100.
How does powerplay bowling affect T20 matches?
Powerplay bowlers can influence the innings by controlling runs, creating dot balls and taking early wickets while fielding restrictions are in place.
Does a strong powerplay guarantee a T20 win?
No. A strong start can provide an advantage, but later batting, bowling, fielding, match conditions and tactical decisions can change the result.
How does the pitch affect powerplay performance?
Pitch characteristics can influence movement, bounce and batting conditions, affecting both the scoring rate and the effectiveness of different bowling styles.
Should powerplay statistics be used for T20 betting analysis?
They can be one component of broader statistical analysis. They should not be treated as a guarantee of match results or financial returns.
How many matches should be used when comparing powerplay statistics?
There is no single correct sample size. A larger sample generally provides more context, while recent matches can capture current team combinations and roles. Ideally, both recent and longer-term data should be considered.
Conclusion
Powerplay performance is an important component of T20 match analysis because the first six overs combine fielding restrictions, aggressive batting opportunities and new-ball bowling.
The most useful analysis goes beyond asking how many runs a team scored.
Look at runs, wickets, run rate, strike rate, boundaries, dot balls, bowling economy, opposition quality, venue and player roles.
The key is context. A powerplay number becomes much more useful when compared with relevant teams, venues, opponents and match situations.
For readers interested in cricket-related online gaming and analysis, the article can naturally include an internal brand destination such as Champ11 Official.
Powerplay statistics can improve understanding of T20 matches, but they cannot eliminate the uncertainty inherent in cricket or guarantee a particular result.
-

Most dismissals in ICC Men’s T20 World Cup
• 25 Apr, 24 • by Champ11When it comes to wicketkeepers in the ICC Men's T20 World Cup, some names consistently stand out for their ability to dismiss batsmen. These wicketkeepers combine sharp reflexes behind the stumps with quick catches to put pressure on the opposing team. Let's look at the top wicketkeepers based on the total number of dismissals they've achieved in the tournament's:
-

The Inspiring Journey of Smriti Mandhana
• 20 Mar, 24 • by Champ11Smriti Mandhana isn't just a cricketer, she's an INSPIRATION. Her story is one of passion, dedication, and pure talent, taking her from playing with her brother in the backyard to becoming a superstar batswoman for India. Born in Mumbai, Smriti's cricketing journey began in Sangli, Maharashtra, where she moved with her family.
-

BCCI & Jay Shah Rewards Domestic Cricketers with Prize Money
• 27 Aug, 24 • by Champ11The Board of Control for Cricket in India (BCCI) has taken a significant step to recognize and reward outstanding performances in domestic cricket.